
2020 Q1 Hindsight
2020 Q1 Hindsight
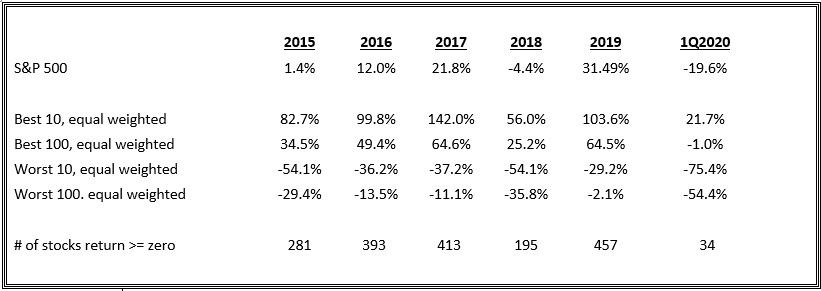
Over the past five calendar years, the S&P 500 has generated an average annual total return of 12% on a capital weighted basis. While the composition of best performing stocks varied yearly, approximately ½ of the stocks in the S&P beat the index return and ½ lagged it on any given year.
What a difference a quarter can make.
- If you bought the top 100 performing stocks in the S&P 500 on an equal weighted basis on Jan 1st this year, you would have lost money yet beaten the S&P 500 total return by 18.6%.
- If you decided to concentrate and picked the top 10 performing stocks on Jan 1st, and again held them for the 1st quarter, you would have generated a total return of 21.7%, 41.3% greater than the S&P for the quarter.
- If instead you somehow picked the 100 worst performing stocks for the 1st quarter, you would have to mark your portfolio down by 54.4%.
- If you were in the worst 10 stocks for the 1st quarter, you would have to mark your portfolio down 75.4%.
*The data in this table was generated from the S&P website at www.spindices.com and Refinitiv, www.refinitiv.com. The calculations from this data were performed internally. Perkins deems these sources to be reliable, but they are not in any way guaranteed and should not be considered as any form of an investment recommendation.
While the average hedge fund was down 7.2% in Q1 according to HFM’s North American Index, the average hedge fund provided significant alpha relative to substantially all long only equity indices.
The quarter’s performance results were so significant that they may reposition many strategy and manager rankings for years to come.
Best wishes to all and stay safe.
J. Douglas Newsome
Managing Director, Director of Research
Perkins Fund Marketing LLC