2025 S&P 500 Perfect Hindsight
Seven companies were added to the S&P 500 in 2025, including Robinhood, Sandisk, AppLovin and Carvana, all of which posted triple-digit percentage gains and top 20 performers in the index.
On the flip side, not every stock that joined the S&P 500 did well. Trade Desk shares were the worst performers in the index with a 67.7% loss, while Block dropped 23.4% and Coinbase gave up 8.9%.
The equal-weighted S&P 500 underperformed the cap weighted index by 6.45%, continuing the trend for the past 22 years! Let that sink in! The13 years prior the equal-weighted in index routinely beat the cap weighted index.
For 2025, the S&P was positive 8 out of 12 months amid news headlines that included: tariff gyrations, AI FOMO including datacenters, crypto sagging while gold surged (Newmont up 170%), and interest rates were cut with possibly more to come in 2026.
Don’t be shy. We would love to hear from you.
Best wishes to all for a happy, healthy and prosperous 2026!
J. Douglas Newsome, CFA
Managing Director, Director of Research
Perkins Fund Marketing LLC
On the flip side, not every stock that joined the S&P 500 did well. Trade Desk shares were the worst performers in the index with a 67.7% loss, while Block dropped 23.4% and Coinbase gave up 8.9%.
The equal-weighted S&P 500 underperformed the cap weighted index by 6.45%, continuing the trend for the past 22 years! Let that sink in! The13 years prior the equal-weighted in index routinely beat the cap weighted index.
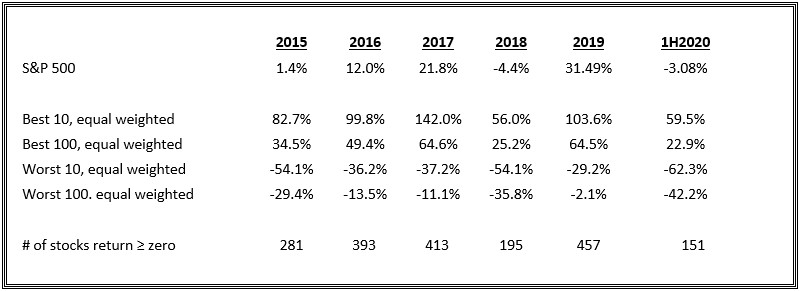
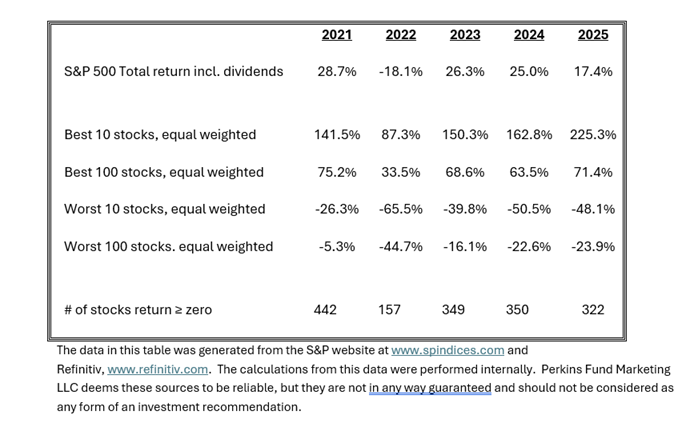
- If you bought the top 100 performing stocks in the S&P 500 on an equal-weighted basis on Jan 2nd, 2025, and held them throughout the year, you would have been up an outstanding 71.4% and crushed the S&P 500 total return by over 54%.
- If you concentrated and picked the top 10 performing stocks on Jan 2nd, and again held them all year, you would have generated an amazing total return of 225.3%, a much higher top ten outperformance and very indicative of the market concentration in 2025.
- If you picked the 100 worst performing stocks for the year, you would have to mark your portfolio down 23.9%.
- If you only owned the worst 10 S&P 500 stocks for the year, you would have finished the period down a miserable 48.1% (and a massive differential to the top 10 performers).
For 2025, the S&P was positive 8 out of 12 months amid news headlines that included: tariff gyrations, AI FOMO including datacenters, crypto sagging while gold surged (Newmont up 170%), and interest rates were cut with possibly more to come in 2026.
Don’t be shy. We would love to hear from you.
Best wishes to all for a happy, healthy and prosperous 2026!
J. Douglas Newsome, CFA
Managing Director, Director of Research
Perkins Fund Marketing LLC